Table of Contents
This is an old revision of the document!
7.1 History of the world
1. Population history
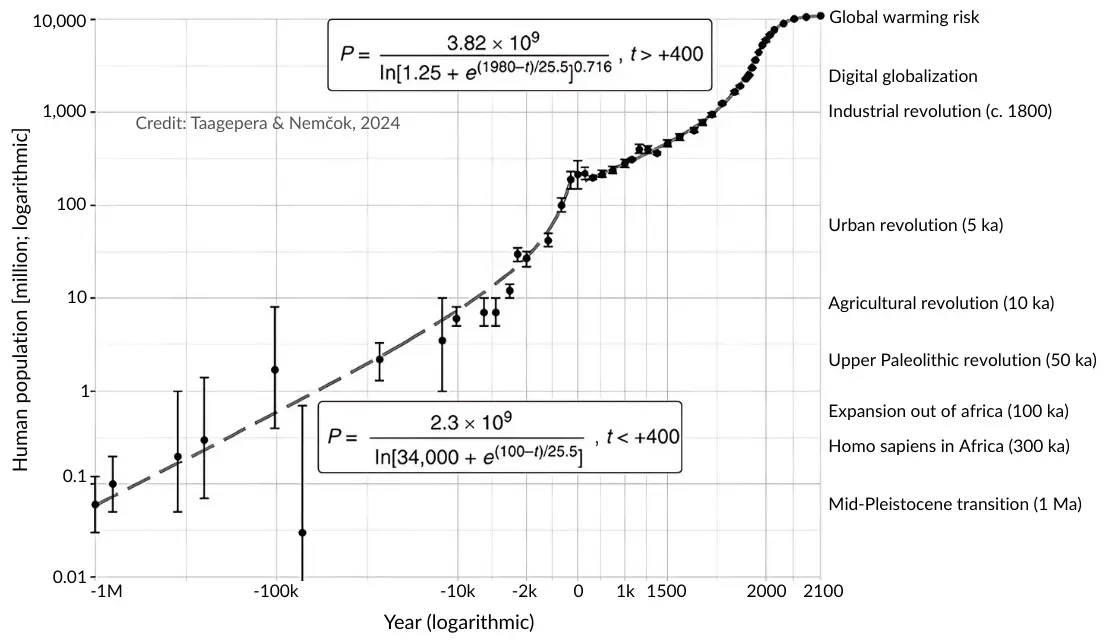
The provided population curve illustrates a remarkable trajectory of human development over the last one million years, beginning with the Mid-Pleistocene transition. During this immense span of time, our ancestors existed in relatively small, fragmented groups, and the logarithmic scale of the graph highlights how slowly the population grew for hundreds of millennia. Environmental constraints and the primitive nature of early tool use meant that the human footprint remained exceptionally light. This initial phase represents the longest period of our history, characterized by a near-equilibrium with the natural world and very gradual evolutionary changes.
Approximately 300,000 years ago, the emergence of Homo sapiens in Africa marked a biological turning point that eventually led to the expansion out of Africa around 100,000 years ago. As shown by the data points and error bars on the graph, this period saw a slight but significant uptick in human numbers as groups migrated into diverse ecological niches. This movement required incredible adaptability and the development of more sophisticated social structures. Although the total population remained below one million, the groundwork for global habitation was being laid through the mastery of fire and increasingly complex stone tools.
The Upper Paleolithic revolution, occurring roughly 50,000 years ago, introduced a surge in cultural and technological complexity that is reflected in the steady rise of the trend line. This era saw the birth of symbolic art, more efficient hunting weapons, and improved clothing, which allowed humans to thrive in colder climates. These innovations facilitated a more reliable food supply and better protection from the elements, pushing the population toward the one-million mark. This cognitive leap forward was the true catalyst for the accelerated growth patterns that would eventually lead to the sedentary lifestyles of the coming millennia.
Around 10,000 years ago, the Agricultural Revolution transformed the human experience from nomadic foraging to settled farming. This shift is visible on the graph as the curve begins to steepen more noticeably, moving toward the ten-million threshold. By domesticating plants and animals, humans created food surpluses that could support larger, permanent communities. This stability allowed for the specialization of labor and the development of early social hierarchies. However, it also introduced new challenges, such as increased disease transmission and a greater dependence on specific crops.
The Urban Revolution, beginning approximately 5,000 years ago, further intensified this growth as the first true cities and civilizations emerged. As the population surpassed the 100-million mark, the curve shows a distinct upward momentum fueled by the rise of trade, writing, and centralized governance. These organized societies were capable of large-scale infrastructure projects and sustained military efforts, which expanded their reach and influence. The graph indicates that during this period, the human population was no longer just reacting to the environment but was actively reshaping it on a continental scale to support growing urban centers.
The Industrial Revolution of the 19th century and the subsequent era of digital globalization represent the most vertical segment of the population curve. In just a few centuries, the human population skyrocketed from approximately one billion to over eight billion, driven by breakthroughs in medicine, sanitation, and energy production. The graph utilizes a specific mathematical formula to track this unprecedented acceleration, showing how technological mastery over the physical and digital worlds removed traditional biological checks on growth. This era turned the steady climb of the past million years into a near-vertical ascent of human presence.
Finally, the graph reaches a plateau labeled as global warming risk, suggesting a period of critical transition and potential stabilization. As the population approaches the year 2100, the mathematical model indicates a slowing of growth as humanity confronts the environmental limits of the planet. This modern era, characterized by hyper-connectivity and immense industrial output, has brought us to a point where our collective actions determine the stability of the global climate. The long history shown on this plot culminates in a moment of profound responsibility, where the survival of the curve depends on sustainable management.
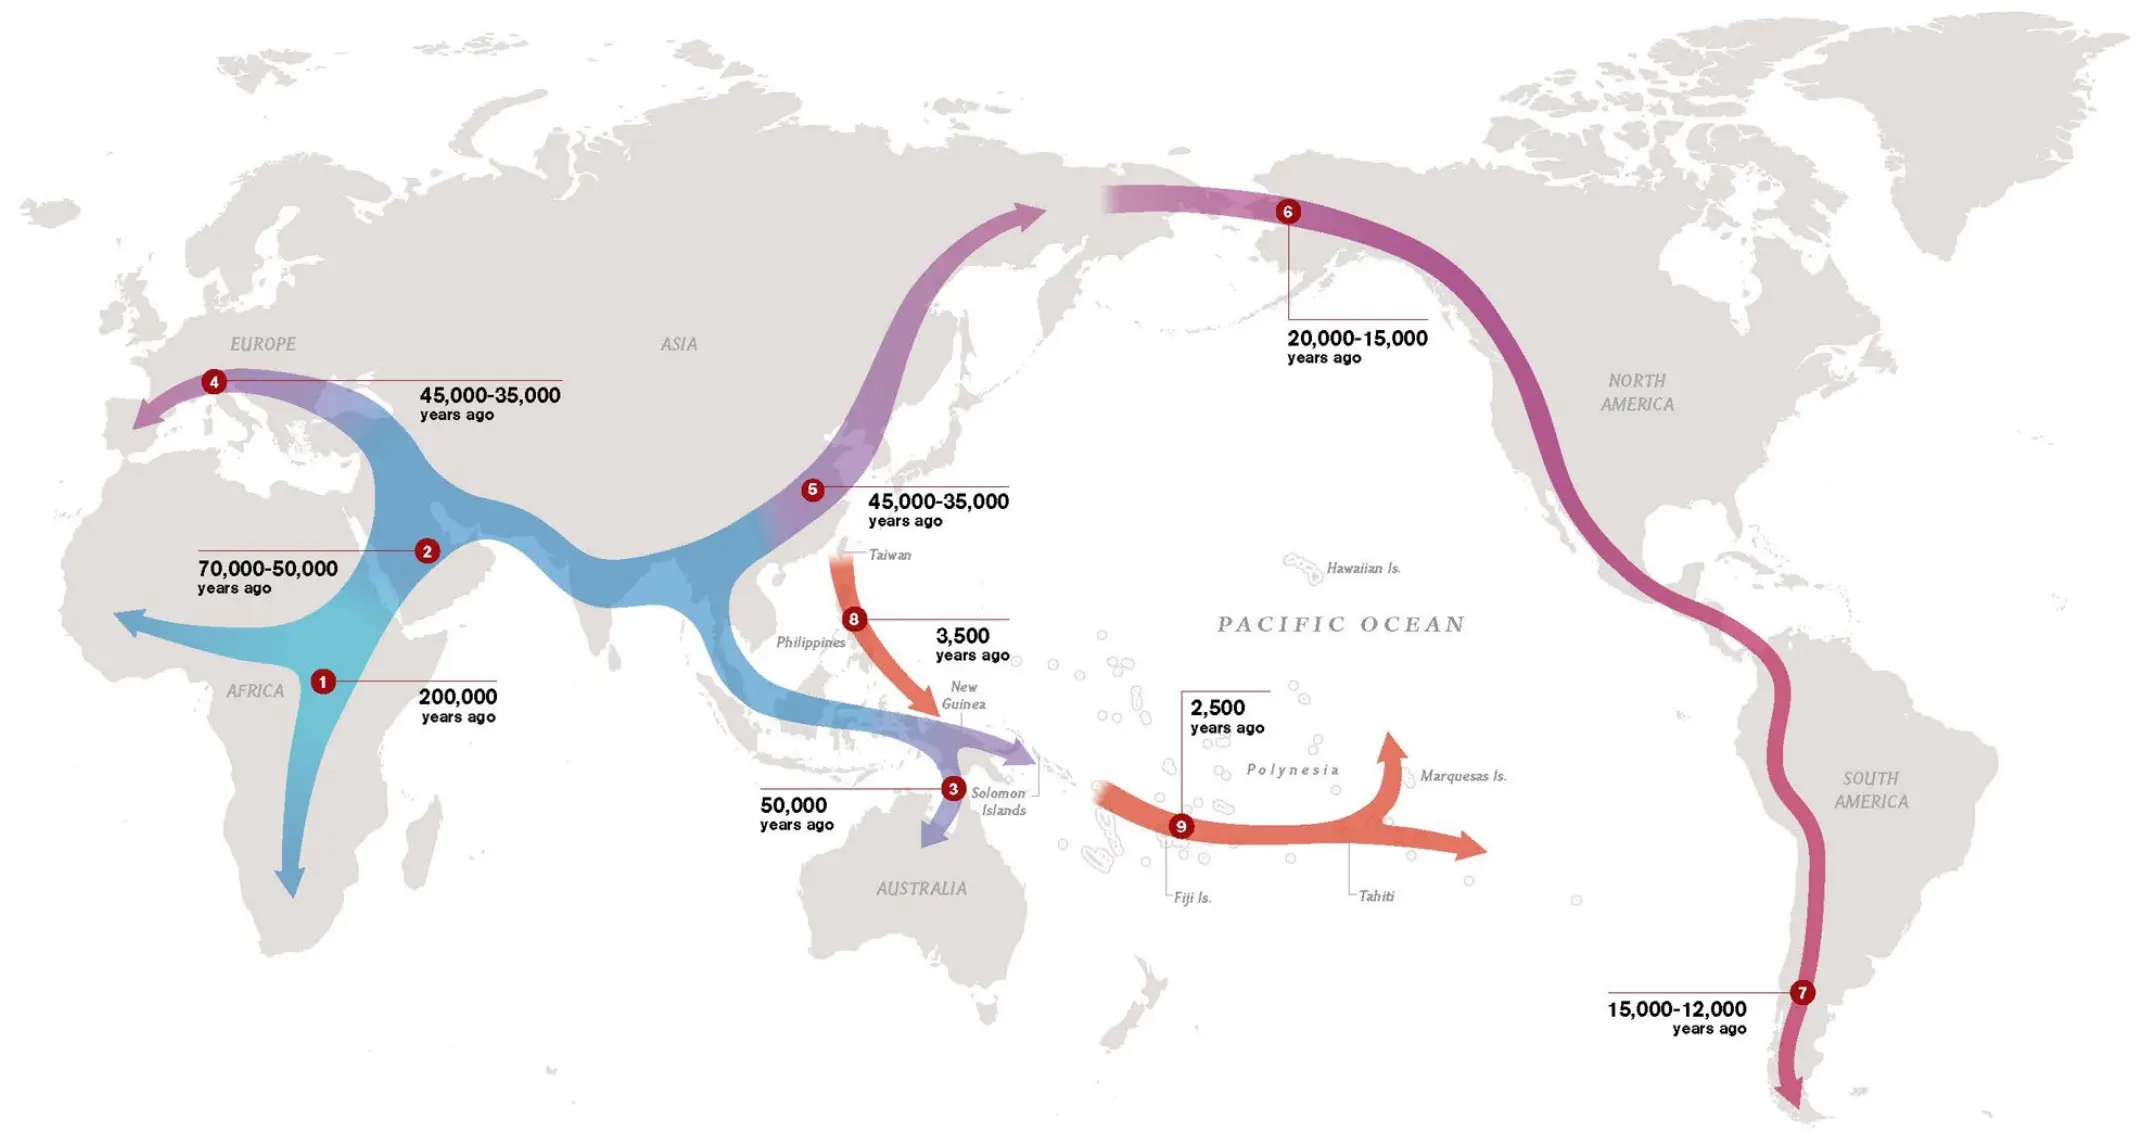
2. Out of Africa